Bureau of National statistics
Agency for Strategic planning and reforms of the Republic of Kazakhstan
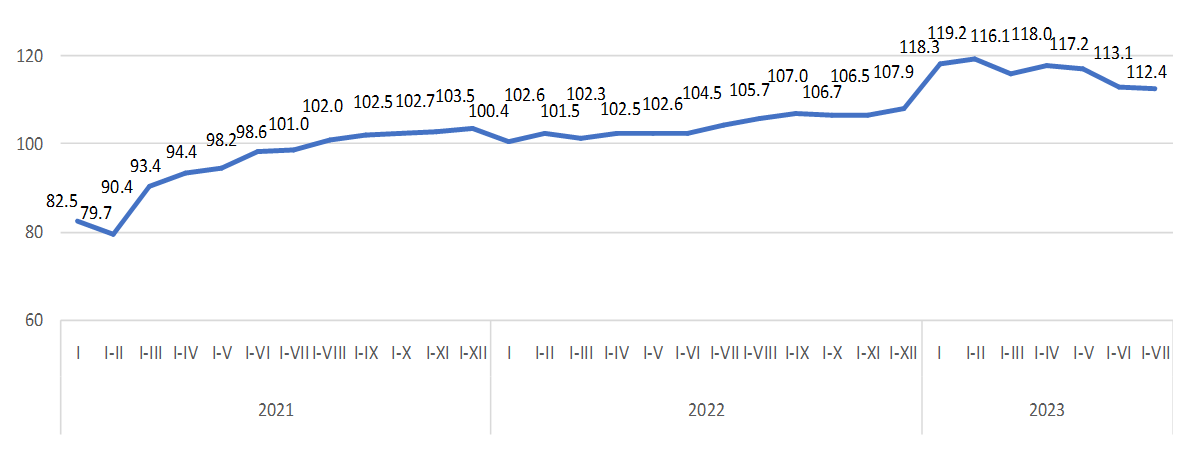
Since August 2021, the volume of investments has been steadily increasing positively in comparison with the corre-sponding period last year.
The significant share of investments falls on Atyrau region (19.9%).
| July 2023 to | January-July 2023 by January-July 2022 | ||
|---|---|---|---|
| June 2023 | July 2022 | ||
| Republic of Kazakhstan | 84.3 | 109.0 | 112.4 |
| Abai | 30.9 | 156.6 | 154.3 |
| Akmola | 68.1 | 87.4 | 111.6 |
| Aktobe | 127.0 | 128.9 | 108.3 |
| Almaty | 71.4 | 102.4 | 116.3 |
| Atyrau | 94.6 | 79.8 | 100.2 |
| BatysKazakhstan | 96.6 | 136.3 | 131.9 |
| Zhambyl | 25.2 | 54.6 | 115.9 |
| Zhetisu | 86.5 | 97.5 | 100.4 |
| Karagandy | 79.1 | 124.2 | 118.3 |
| Kostanai | 105.7 | 94.8 | 114.6 |
| Kyzylorda | 98.6 | 129.4 | 124.2 |
| Mangystau | 104.9 | 169.3 | 145.9 |
| Pavlodar | 57.0 | 103.1 | 124.9 |
| SoltustikKazakhstan | 56.6 | 120.5 | 101.0 |
| Turkistan | 83.2 | 219.1 | 122.5 |
| Ulytau | 133.7 | 131.0 | 104.5 |
| ShygysKazakhstan | 56.2 | 106.4 | 110.1 |
| Astanacity | 111.6 | 121.9 | 109.6 |
| Almatycity | 121.5 | 105.5 | 101.6 |
| Shymkentcity | 101.8 | 103.3 | 123.9 |
About half of the national volume of capital investments is carried out by large and medium-sized enterprises.
| Mastered investments in fixed capital | Including | |||
|---|---|---|---|---|
| small businesses | medium -sizedenterprises | large enterprises | ||
| January-July 2021 | 6 223 140 581 | 3 170 875 778 | 557 031 905 | 2 495 232 898 |
| January-July 2022 | 6 872 033 139 | 3 601 056 027 | 346 440 300 | 2 924 536 812 |
| January-July 2023 | 8 103 721 745 | 4 154 501 058 | 537 100 850 | 3 412 119 837 |
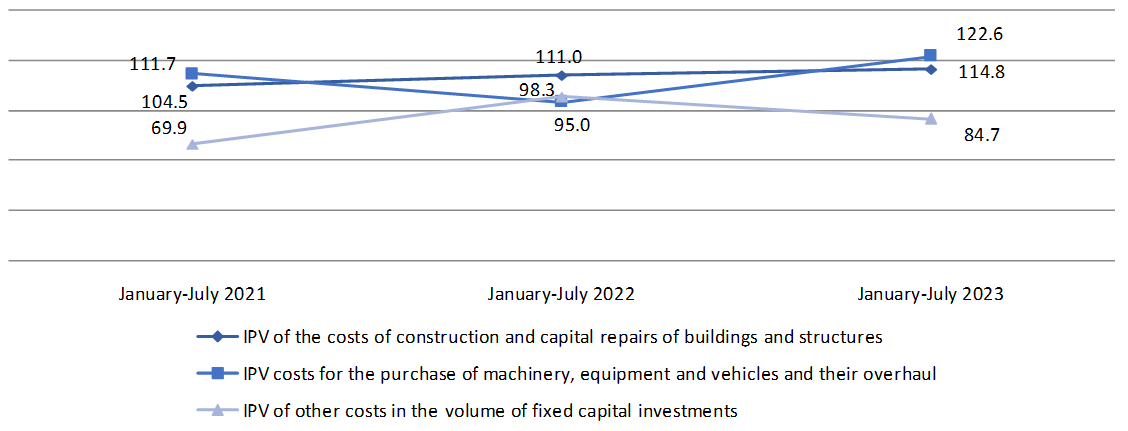
Almost 60% of the total costs are for construction and major repairs of buildings and structures, about 30% of the total volume for the purchase of machinery, equipment and vehicles.
The predominant sources of investment financing remain the own funds of economic entities, the volume of which in January-July 2023 amounted to 6161.1 billion tenge or 76% of the total.
Budget funds accounted for 14.3% of the total investment in fixed capital, while compared with January-July 2022 in-creased by 25%.
For the banking sector, the financing of the real sector of the economy in the total volume of investments in fixed capi-tal takes 2.1%.
| January-July 2023 | For reference: as a percentage of the total | |||
|---|---|---|---|---|
| thousand tenge | as a percentage of the total | January-July 2022 | January-July 2021 | |
| Investments in fixed capital | 8 103 721 745 | 100,0 | 100.0 | 100.0 |
| including at the expense of funds: | ||||
| state budget | 1 159 563 293 | 14.3 | 12.9 | 12.8 |
| Ownfunds | 6 161 111 996 | 76.0 | 75.4 | 72.6 |
| Bankloans | 170 523 876 | 2.1 | 3.0 | 2.6 |
| of them: | ||||
| loans from foreign banks | 1 447 017 | 0.0 | 0.3 | 0.9 |
| other borrowed funds | 612 522 580 | 7.6 | 8.8 | 12.1 |
| of them: | ||||
| borrowed funds of non-residents | 223 261 896 | 2.8 | 1.4 | 2.1 |
A main share of investments in fixed capital in January-July 2023 accounted for industry (49.2%) (including mining and quarrying - 32.4%, manufacturing industry - 8.3%), operations with real estate (19.2%),transport and warehousing (11.9%) and agriculture, forestryandfisheries (6.1%).
| Investments in fixed capital, thousand tenge | in % by January-July 2022 | Share in the total volume of investments, as a percentage | |
|---|---|---|---|
| Total | 8 103 721 745 | 112.4 | 100.0 |
| Including: | |||
| Agriculture, forestryandfisheries | 491 113 904 | 121.3 | 6.1 |
| Industry | 3 987 801 332 | 109.0 | 49.2 |
| Including: | |||
| Miningandquarrying | 2 624 055 330 | 108.4 | 32,4 |
| Manufacturingindustry | 673 038 355 | 88.9 | 8.3 |
| Supply of electricity, gas, steam, hot water and air conditioning | 446 628 903 | 149.7 | 5.5 |
| Water supply; collection, treatment and disposal of waste, activities for the elimination of pollution | 244 078 746 | 141.4 | 3.0 |
| Construction | 94 576 829 | 104.4 | 1.2 |
| Wholesale and retail trade; car and motorcycle repair | 185 128 135 | 122.6 | 2.3 |
| Transportandwarehousing | 966 655 717 | 157.7 | 11.9 |
| Provision of accommodation and food services | 64 390 396 | 121.9 | 0.8 |
| Informationandcommunication | 61 544 731 | 96.5 | 0.8 |
| Financialandinsuranceactivities | 56 898 290 | 89.9 | 0.7 |
| Operationswithrealestate | 1 556 088 423 | 100.6 | 19.2 |
| Professional, scientific and technical activities | 45 080 631 | 168.2 | 0.6 |
| Administrative and support services activities | 82445437 | 126.1 | 1.0 |
| Public administration and defense; compulsory social security | 69 471 001 | 136.6 | 0.9 |
| Education | 191 229 255 | 124.3 | 2.4 |
| Healthcare and social services for the population | 143 797 839 | 143.9 | 1.8 |
| Arts, entertainmentandrecreation | 88 339 181 | 114.5 | 1.1 |
| Provision of other types of services | 19 160 632 | 52.7 | 0.2 |
Investments in fixed capital - investments in order for investors to obtain an economic, social or environmental ef-fect in the case of new construction, as well as expansion, reconstruction and modernization of facilities (which lead to an increase in the initial cost of the facility), the purchase of machinery, equipment, vehicles, for the formation of the main herd, perennial plantings, etc.
The costs of construction and installation works and capital repairs include the costs of a complex of works on the construction of buildings and structures, expansion, reconstruction, installation of energy, technological and other equip-ment, as well as the costs of capital repairs of non-residential, residential buildings and structures.
The cost of purchasing machinery and equipment - an element of the technological structure of investments, in-cluding the cost of purchasing machinery, vehicles, equipment.
Other costs in the volume of investments in fixed capital – the costs of design and survey work, supervision, maintenance of directorates of objects under construction, the costs of cultivated biological costs, as well as the costs of objects created or acquired by organizations used in economic activity for more than one year, having a monetary valua-tion, having the ability to alienate and generating income, but which are not material values.
The index of the physical volume of investments in fixed capital characterizes the change in investment invest-ments in dynamics, is determined by the ratio of the volume of investments in fixed capital in the reporting and compared period at comparable prices
Statistical information on investments in fixed capital is formed on the basis of primary statistical data of national statistical observations of economic entities engaged in investment activities (regardless of the number of employees and type of economic activity) and national statistical observations on the commissioning of facilities by individual developers.
Accounting of investment investments is provided at the place of actual implementation, regardless of the place of registration of the economic entity engaged in investment activities.
Operational data on investments in fixed capital, formed on a monthly basis, are updated with annual data.
By types of economic activity, data on investments in fixed capital are formed according to the direction of use (depends on the nature of the direction of investment (end use) and by the type of economic activity of the investor.
More detailed methodological explanations are available at the following link:
Methodology for the formation of indicators of investment activity statistics


