Bureau of National statistics
Agency for Strategic planning and reforms of the Republic of Kazakhstan
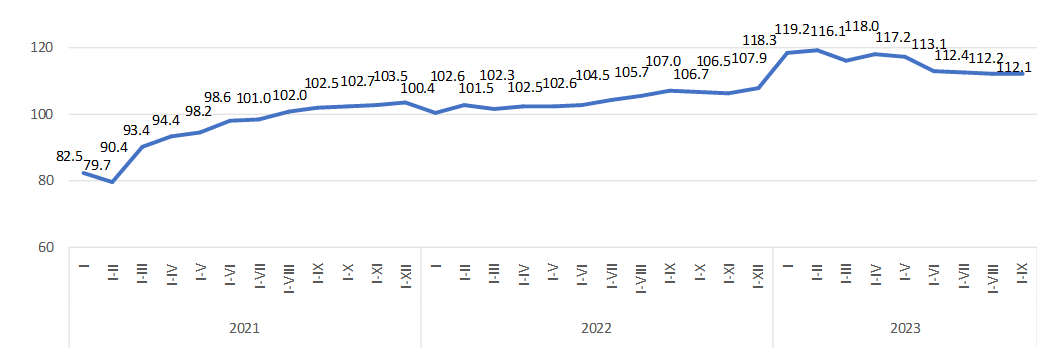
Since August 2021, the volume of investments has been steadily increasing positively in comparison with the corre-sponding period last year.
The significant share of investments falls on Atyrau region (18.9%).
| September 2023 to | January-September 2023 by January-September 2022 | ||
|---|---|---|---|
| August 2023 | September 2022 | ||
| Republic of Kazakhstan | 128.8 | 112.4 | 112.1 |
| Abai | 187.9 | 105.5 | 135.7 |
| Akmola | 40.7 | 50.4 | 111.8 |
| Aktobe | 117.5 | 109.6 | 107.8 |
| Almaty | 67.9 | 58.2 | 105.4 |
| Atyrau | 157.7 | 123.4 | 99.7 |
| Batys Kazakhstan | 123.7 | 117.5 | 122.7 |
| Zhambyl | 171.4 | 78.5 | 102.0 |
| Zhetisu | 158.1 | 175.6 | 123.9 |
| Karagandy | 234.4 | 113.8 | 116.5 |
| Kostanai | 125.6 | 91.3 | 108.2 |
| Kyzylorda | 105.7 | 121.7 | 125.6 |
| Mangystau | 45.4 | 82.0 | 143.3 |
| Pavlodar | 111.6 | 159.9 | 135.6 |
| Soltustik Kazakhstan | 173.5 | 156.2 | 116.1 |
| Turkistan | 218.1 | 144.3 | 136.5 |
| Ulytau | 224.5 | 204.0 | 121.3 |
| Shygys Kazakhstan | 239.4 | 93.7 | 103.6 |
| Astana city | 164.8 | 114.7 | 105.3 |
| Almaty city | 122.3 | 111.3 | 101.5 |
| Shymkent city | 84.4 | 127.9 | 126.7 |
About half of the national volume of capital investments is carried out by large and medium-sized enterprises.
| Mastered investments in fixed capital | Including | |||
|---|---|---|---|---|
| small businesses | medium -sized enterprises | large enterprises | ||
| January-September 2021 | 8 722 827 290 | 4 644 416 419 | 742 612 463 | 3 335 798 408 |
| January-September 2022 | 9 859 687 913 | 5 298 201 378 | 503 335 136 | 4 058 151 399 |
| January-September 2023 | 11 641 119 630 | 6 256 912 170 | 759 373 619 | 4 624 833 841 |
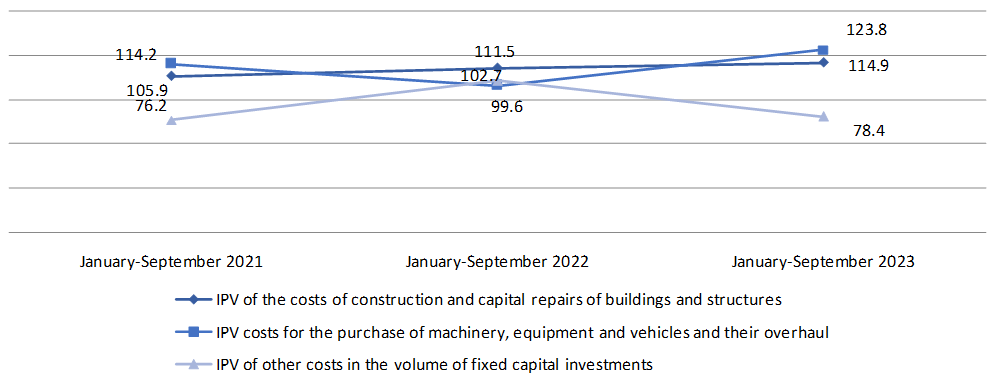
Almost 60% of the total costs are for construction and major repairs of buildings and structures, more than a quarter of the total amount is for the purchase of machinery, equipment and vehicles.
The predominant sources of investment financing remain the own funds of economic entities, the volume of which in January-September 2023 amounted to 8736.0 billion tenge or 75% of the total.
Budget funds accounted for 14.5% of the total investment in fixed capital, while compared with January-September 2022 increased by 18.3%.
For the banking sector, the financing of the real sector of the economy in the total volume of investments in fixed capi-tal takes 2.6%.
| January-September 2023 | For reference: as a percentage of the total | |||
|---|---|---|---|---|
| thousand tenge | as a percentage of the total | January-September 2022 | January-September 2021 | |
| Investments in fixed capital | 11 641 119 630 | 100.0 | 100.0 | 100.0 |
| including at the expense of funds: | ||||
| state budget | 1 689 391 620 | 14.5 | 13.7 | 13.5 |
| Ownfunds | 8 736 015 229 | 75.0 | 74.6 | 72.0 |
| Bankloans | 297 970 088 | 2.6 | 2.6 | 2.6 |
| of them: | ||||
| loans from foreign banks | 4 064 389 | 0.0 | 0.2 | 0.7 |
| other borrowed funds | 917 742 693 | 7.9 | 9.1 | 11.9 |
| of them: | ||||
| borrowed funds of non-residents | 311 017 991 | 2.7 | 1.8 | 2.1 |
A main share of investments in fixed capital in January-September 2023 accounted for industry (47.9%) (including mining and quarrying - 29.6%, manufacturing industry - 8.8%), operations with real estate (18.3%), transport and warehousing (13.4%) and agriculture, forestry and fisheries (6.1%).
| Investments in fixed capital, thousand tenge | in % by January-September 2022 | Share in the total volume of investments, as a percentage | |
|---|---|---|---|
| Total | 11 641 119 630 | 112.1 | 100.0 |
| Including: | |||
| Agriculture, forestry and fisheries | 713 585 955 | 112.9 | 6.1 |
| Industry | 5 574 807 631 | 108.2 | 47.9 |
| Including: | |||
| Mining and quarrying | 3 448 151 833 | 104.4 | 29.6 |
| Manufacturing industry | 1 027 192 280 | 93.6 | 8.8 |
| Supply of electricity, gas, steam, hot water and air conditioning | 737 983 097 | 162.1 | 6.3 |
| Water supply; collection, treatment and disposal of waste, activities for the elimination of pollution | 361 480 427 | 128.5 | 3.1 |
| Construction | 130 608 380 | 90.3 | 1.1 |
| Wholesale and retail trade; car and motorcycle repair | 315 476 331 | 137.4 | 2.7 |
| Transport and warehousing | 1 559 023 351 | 159.6 | 13.4 |
| Provision of accommodation and food services | 84 898 947 | 102.0 | 0.7 |
| Information and communication | 123 555 854 | 123.9 | 1.1 |
| Financial and insurance activities | 77 511 424 | 88.8 | 0.7 |
| Operations with real estate | 2 127 140 463 | 99.0 | 18.3 |
| Professional, scientific and technical activities | 56 390 251 | 151.7 | 0.5 |
| Administrative and support services activities | 110 582 410 | 108.0 | 0.9 |
| Public administration and defense; compulsory social security | 98 754 750 | 115.0 | 0.8 |
| Education | 283 387 042 | 123.7 | 2.4 |
| Healthcare and social services for the population | 209 434 477 | 144.6 | 1.8 |
| Arts, entertainment and recreation | 141 606 389 | 113.5 | 1.2 |
| Provision of other types of services | 34 355 812 | 54.2 | 0.3 |
Investments in fixed capital - investments in order for investors to obtain an economic, social or environmental ef-fect in the case of new construction, as well as expansion, reconstruction and modernization of facilities (which lead to an increase in the initial cost of the facility), the purchase of machinery, equipment, vehicles, for the formation of the main herd, perennial plantings, etc.
The costs of construction and installation works and capital repairs include the costs of a complex of works on the construction of buildings and structures, expansion, reconstruction, installation of energy, technological and other equip-ment, as well as the costs of capital repairs of non-residential, residential buildings and structures.
The cost of purchasing machinery and equipment - an element of the technological structure of investments, in-cluding the cost of purchasing machinery, vehicles, equipment.
Other costs in the volume of investments in fixed capital – the costs of design and survey work, supervision, maintenance of directorates of objects under construction, the costs of cultivated biological costs, as well as the costs of objects created or acquired by organizations used in economic activity for more than one year, having a monetary valua-tion, having the ability to alienate and generating income, but which are not material values.
The index of the physical volume of investments in fixed capital characterizes the change in investment invest-ments in dynamics, is determined by the ratio of the volume of investments in fixed capital in the reporting and compared period at comparable prices
Statistical information on investments in fixed capital is formed on the basis of primary statistical data of national statistical observations of economic entities engaged in investment activities (regardless of the number of employees and type of economic activity) and national statistical observations on the commissioning of facilities by individual developers.
Accounting of investment investments is provided at the place of actual implementation, regardless of the place of registration of the economic entity engaged in investment activities.
Operational data on investments in fixed capital, formed on a monthly basis, are updated with annual data.
By types of economic activity, data on investments in fixed capital are formed according to the direction of use (depends on the nature of the direction of investment (end use) and by the type of economic activity of the investor.
More detailed methodological explanations are available at the following link:
Methodology for the formation of indicators of investment activity statisticsStatistical compilation "Investment and construction activities in the Republic of Kazakhstan"


